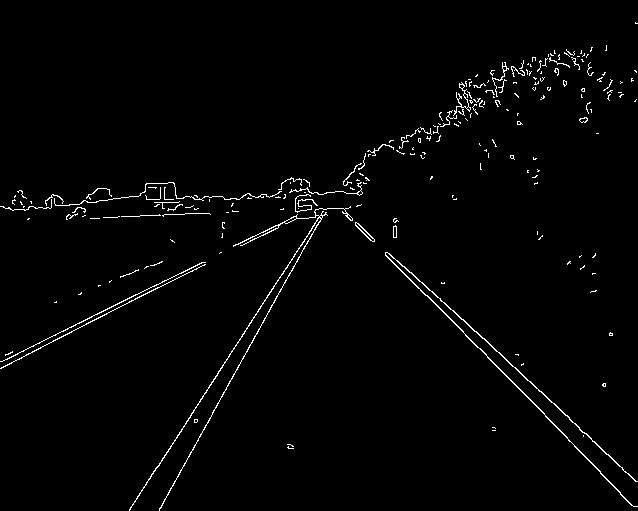
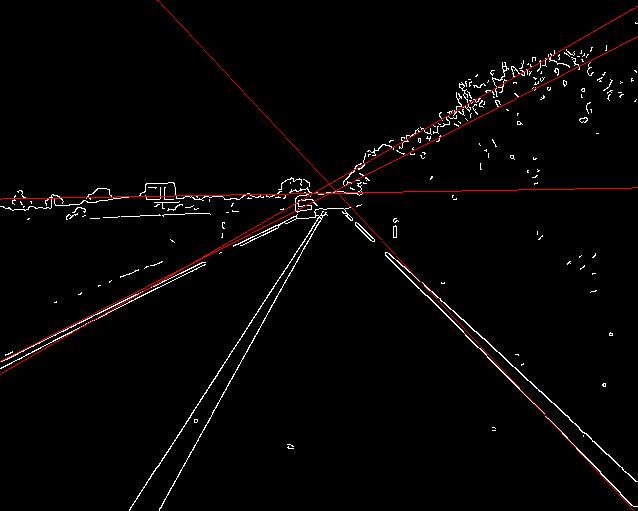
1
2
3
4
5
6
7
8
9
10
11
12
13
14
15
16
17
18
19
20
21
22
23
24
25
26
27
28
29
30
31
32
33
34
35
36
37
38
39
40
41
42
43
44
45
46
47
48
49
50
51
52
53
54
55
56
57
58
59
60
61
62
63
64
65
66
67
68
69
70
71
72
73
74
75
76
77
78
79
80
81
82
83
84
85
86
87
88
89
90
91
92
93
94
95
96
97
98
99
100
101
102
103
104
105
106
107
108
109
110
111
112
113
114
115
116
117
118
119
120
121
122
123
124
125
126
127
128
129
130
131
| from PIL import Image
import matplotlib.pyplot as plt
import numpy as np
import canny
import math
def to_gray(img):
height, width, _ = img.shape
gray = np.zeros((height, width), dtype=np.uint8)
k = np.array([0.299, 0.587, 0.114])
for i in range(height):
for j in range(width):
gray[i][j] = (k * img[i][j]).sum()
return gray
def to_rgb(img):
height, width = img.shape
rgb = np.zeros((height, width, 3), dtype=np.uint8)
for i in range(height):
for j in range(width):
rgb[i][j] = [img[i][j]] * 3
return rgb
def plot_line(img, expression):
if len(img.shape) != 3 or img.shape[2] != 3:
print('The image shape must be (height, width, 3)')
return img
height = img.shape[0]
width = img.shape[1]
def func(x, a, b):
return int(a * x + b)
for exp in expression:
a, b = exp
point = [(x, func(x, a, b)) for x in range(width)
if 0 <= func(x, a, b) < height]
for x, y in point:
img[y][x] = [255, 0, 0]
return img
def hough_check(img, precision=360, threshold=50, number=-1):
height, width = img.shape
theta = range(0, precision)
factor = 360 / precision
tab_height = len(theta)
tab_width = (height + width) << 1
tab = [[0] * tab_width for i in range(tab_height)]
for i in range(height):
for j in range(width):
if img[i][j] == 255:
for k in theta:
arc = k * factor * math.pi / 180
rho = int(j * math.cos(arc) + i * math.sin(arc))
tab[k][rho + height + width] += 1
line = []
for i in range(tab_height):
for j in range(tab_width):
if tab[i][j] > threshold:
line.append((i * factor, j - height - width))
if number == -1 or len(line) <= number:
return line
else:
line.sort(key=lambda x: tab[int(x[0] / factor)][x[1] + height + width])
return line[0:number]
def get_expression(pair):
theta, rho = pair
theta = theta * math.pi / 180
k = -math.cos(theta) / (math.sin(theta) + 1e-8)
b = rho / (math.sin(theta) + 1e-8)
return k, b
def hough_with_canny():
filename = 'hf.jpg'
rgb_img = Image.open(filename)
gray_img = rgb_img.convert('L')
gray_array = np.array(gray_img)
gray_array = canny.canny(gray_array, (3, 3))
line = hough_check(gray_array, number=5)
print('The number of lines is {}'.format(len(line)))
expression = [get_expression(x) for x in line]
rgb_array = to_rgb(gray_array)
rgb_array = plot_line(rgb_array, expression)
plt.figure()
plt.imshow(rgb_array)
plt.show()
def hough_without_canny():
filename = 'gray.jpg'
rgb_img = Image.open(filename)
gray_img = rgb_img.convert('L')
gray_array = np.array(gray_img)
rgb_array = to_rgb(gray_array)
line = hough_check(gray_array, number=5)
print('The number of lines is {}'.format(len(line)))
expression = [get_expression(x) for x in line]
rgb_array = plot_line(rgb_array, expression)
plt.figure()
plt.imshow(rgb_array)
plt.show()
if __name__ == '__main__':
hough_without_canny()
|
